
If we are looking for a free application tool to monitor all applications in our environment, then Prometheus can be an option. By default, Prometheus stores all data as time series: streams of timestamped values belonging to the same metric and the same set of labeled dimensions. Prometheus is a open-source systems monitoring toolkit used for event monitoring and alerting. Prometheus also can be used to generate temporary derived time series as the result of queries.
Prometheus was developed at SoundCloud starting in 2012. In this short article we will learn how to install Prometheus on Debian 11 operating system.
Prometheus Installation on Debian 11
The Prometheus installation on Debian 11 steps will be described on several steps.
- Create Prometheus system user and group
- Create new directories for configuration and data
- Download and Install Prometheus on Debian 11
- Create/Edit a Prometheus configuration file
- Create a Prometheus systemd Service unit file
- Access Prometheus Web Page
The details Prometheus installation will be detail discussed below.
1. Create Prometheus System User and Group
At this step, we will create a dedicated Prometheus system user and group on the system where a new a system user doesn’t need /bin/bash shell, so we will use -s /sbin/nologin parameter.
$ sudo groupadd --system prometheus
$ sudo useradd -s /sbin/nologin --system -g prometheus prometheus
Output :
[ramans@otodiginet ~]$ sudo groupadd --system prometheus
[sudo] password for ramans:
[ramans@otodiginet ~]$ sudo useradd -s /sbin/nologin --system -g prometheus prometheus
2. Create New Dedicated Directory
At this step, we will create new dedicated directories for Prometheus configuration and data.
$ sudo mkdir /var/lib/prometheus
$ for i in rules rules.d files_sd; do sudo mkdir -p /etc/prometheus/${i}; done
3. Download and Install Prometheus on Debian 11
The next step is to download Prometheus archive and extract it to get binary files from Prometheus official Github repository.
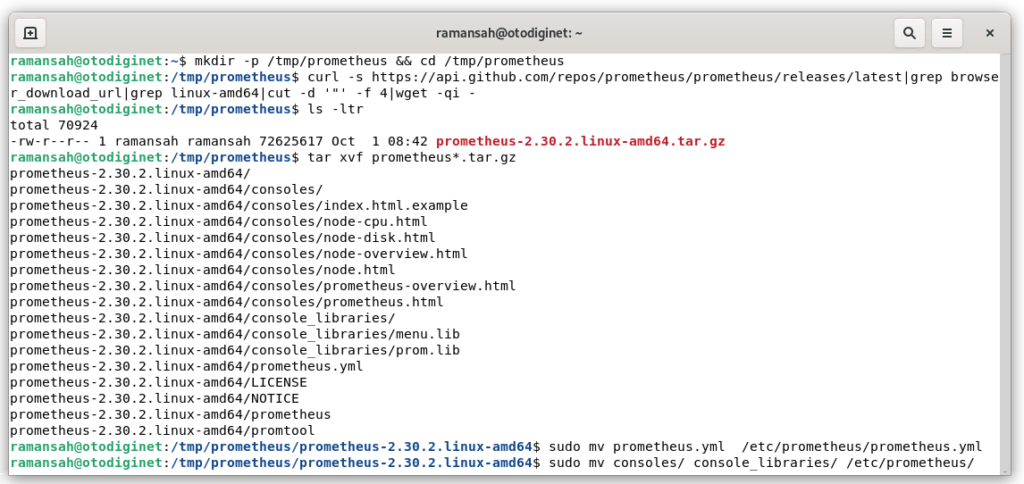
$ mkdir -p /tmp/prometheus && cd /tmp/prometheus
$ curl -s https://api.github.com/repos/prometheus/prometheus/releases/latest|grep browser_download_url|grep linux-amd64|cut -d '"' -f 4|wget -qi -
$ tar xvf prometheus*.tar.gz
Output :
ramansah@otodiginet:~$ mkdir -p /tmp/prometheus && cd /tmp/prometheus
ramansah@otodiginet:/tmp/prometheus$ curl -s https://api.github.com/repos/prometheus/prometheus/releases/latest|grep browser_download_url|grep linux-amd64|cut -d '"' -f 4|wget -qi -
ramansah@otodiginet:/tmp/prometheus$ ls -ltr
total 70924
-rw-r--r-- 1 ramansah ramansah 72625617 Oct  1 08:42 prometheus-2.30.2.linux-amd64.tar.gz
ramansah@otodiginet:/tmp/prometheus$ tar xvf prometheus*.tar.gz
prometheus-2.30.2.linux-amd64/
prometheus-2.30.2.linux-amd64/consoles/
prometheus-2.30.2.linux-amd64/consoles/index.html.example
prometheus-2.30.2.linux-amd64/consoles/node-cpu.html
prometheus-2.30.2.linux-amd64/consoles/node-disk.html
prometheus-2.30.2.linux-amd64/consoles/node-overview.html
prometheus-2.30.2.linux-amd64/consoles/node.html
prometheus-2.30.2.linux-amd64/consoles/prometheus-overview.html
prometheus-2.30.2.linux-amd64/consoles/prometheus.html
prometheus-2.30.2.linux-amd64/console_libraries/
prometheus-2.30.2.linux-amd64/console_libraries/menu.lib
prometheus-2.30.2.linux-amd64/console_libraries/prom.lib
prometheus-2.30.2.linux-amd64/prometheus.yml
prometheus-2.30.2.linux-amd64/LICENSE
prometheus-2.30.2.linux-amd64/NOTICE
prometheus-2.30.2.linux-amd64/prometheus
prometheus-2.30.2.linux-amd64/promtool
4. Update Prometheus Config File
After extracting the archive file, then we will update Prometheus configuration file, prometheus.yml. First we will locate the configuration file to /etc/prometheus/ directory.
ramansah@otodiginet:/tmp/prometheus/prometheus-2.30.2.linux-amd64$ sudo mv prometheus.yml  /etc/prometheus/prometheus.yml
ramansah@otodiginet:/tmp/prometheus/prometheus-2.30.2.linux-amd64$ sudo mv consoles/ console_libraries/ /etc/prometheus/
We will edit configuration file by submitting command line :
sudo vi /etc/prometheus/prometheus.yml
# my global config
global:
  scrape_interval: 15s # Set the scrape interval to every 15 seconds. Default is every 1 minute.
  evaluation_interval: 15s # Evaluate rules every 15 seconds. The default is every 1 minute.
  # scrape_timeout is set to the global default (10s).

# Alertmanager configuration
alerting:
  alertmanagers:
    - static_configs:
        - targets:
          # - alertmanager:9093

# Load rules once and periodically evaluate them according to the global 'evaluation_interval'.
rule_files:
  # - "first_rules.yml"
  # - "second_rules.yml"

# A scrape configuration containing exactly one endpoint to scrape:
# Here it's Prometheus itself.
scrape_configs:
  # The job name is added as a label `job=<job_name>` to any timeseries scraped from this config.
  - job_name: "prometheus"

    # metrics_path defaults to '/metrics'
    # scheme defaults to 'http'.

    static_configs:
      - targets: ["localhost:9090"]
5. Create Prometheus systemd Service unit File
To be able to manage Promethues service by using systemd, we need to create a new unit file for Prometheus. We wil create a new file called as /etc/systemd/system/prometheus.service.
$ sudo vi /etc/systemd/system/prometheus.service
Output :
ramansah@otodiginet:~$ sudo vi /etc/systemd/system/prometheus.service

[Unit]
Description=Prometheus
Documentation=https://prometheus.io/docs/introduction/overview/
Wants=network-online.target
After=network-online.target

[Service]
Type=simple
User=prometheus
Group=prometheus
ExecReload=/bin/kill -HUP $MAINPID
ExecStart=/usr/local/bin/prometheus \
  --config.file=/etc/prometheus/prometheus.yml \
  --storage.tsdb.path=/var/lib/prometheus \
  --web.console.templates=/etc/prometheus/consoles \
  --web.console.libraries=/etc/prometheus/console_libraries \
  --web.listen-address=0.0.0.0:9090 \
  --web.external-url=

SyslogIdentifier=prometheus
Restart=always

[Install]
WantedBy=multi-user.target
Then we have to change the ownership of these directories to Prometheus user and group by submitting command line :
ramansah@otodiginet:~$ for i in rules rules.d files_sd; do sudo chown -R prometheus:prometheus /etc/prometheus/${i}; done
[sudo] password for ramansah:
ramansah@otodiginet:~$ for i in rules rules.d files_sd; do sudo chmod -R 775 /etc/prometheus/${i}; done
ramansah@otodiginet:~$ sudo chown -R prometheus:prometheus /var/lib/prometheus/
After all are set, then we will reload the Prometheus service, by submitting following command lines:
$ sudo systemctl daemon-reload
$ sudo systemctl start prometheus
$ systemctl status prometheus
Output :
ramansah@otodiginet:~$ sudo systemctl daemon-reload
ramansah@otodiginet:~$ sudo systemctl start prometheus
ramansah@otodiginet:~$ systemctl status prometheus
● prometheus.service - Prometheus
     Loaded: loaded (/etc/systemd/system/prometheus.service; disabled; vendor preset: enabled)
     Active: active (running) since Tue 2021-02-13 04:26:08 EDT; 3min 4s ago
       Docs: https://prometheus.io/docs/introduction/overview/
   Main PID: 8471 (prometheus)
      Tasks: 8 (limit: 4623)
     Memory: 70.3M
        CPU: 269ms
     CGroup: /system.slice/prometheus.service
             └─8471 /usr/local/bin/prometheus --config.file=/etc/prometheus/prometheus.yml --storage.tsdb.path=/var/lib/pro>
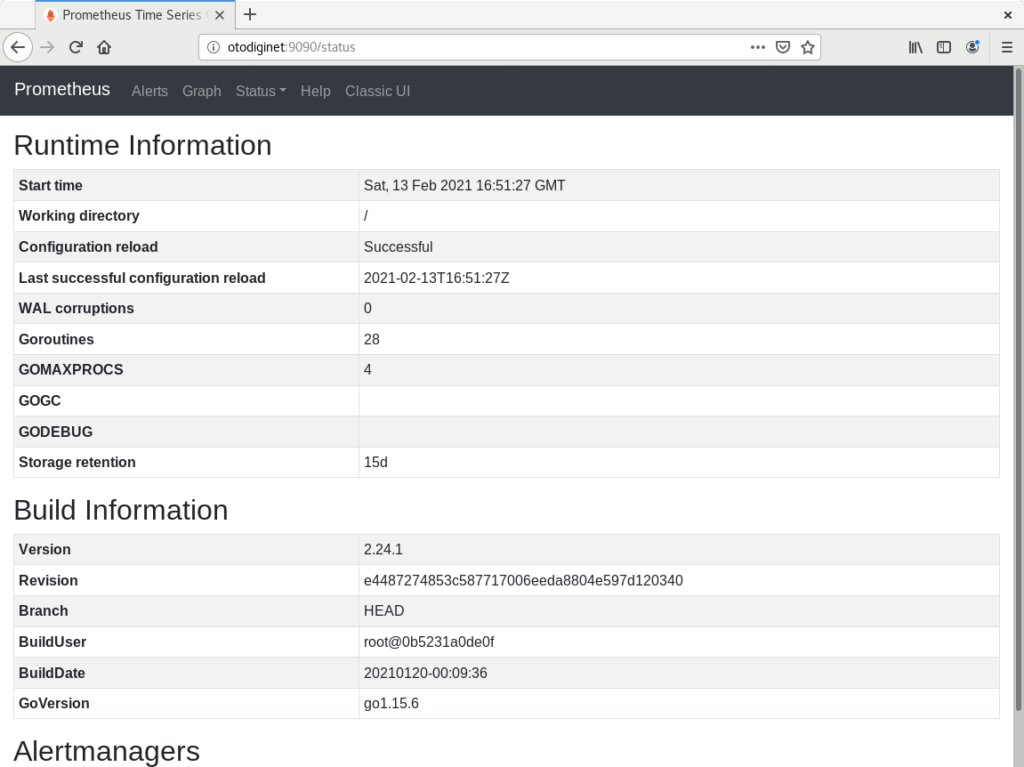
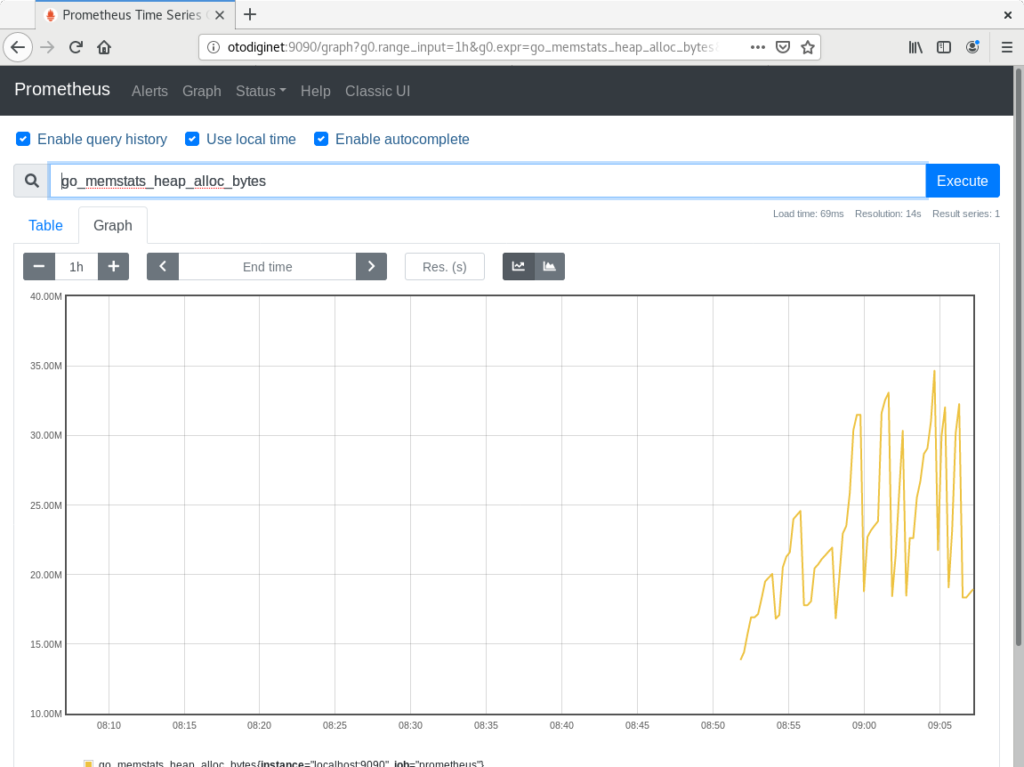
6. Access Prometheus Web Interface
Until this stage, we have successfully installed Prometheus monitoring system. Then we will access Promethues web interface which is located on URL http://[ip_hostname_or_ip_address]:9090.

Conclusion
In this short tutorila, we have learned how to install Prometheus on Debian 11 operating system successfully.