
Grafana is a multi-platform open source analytics and interactive visualization web based application. Grafana provides charts, graphs, and alerts, ussually when it is connected to supported data sources (Graphite, Elasticsearch, OpenTSDB, Prometheus, and InfluxDB).
There are available two edition of Grafana, namely: Enterprise and OSS edition. On this article we will install Grafana OSS stable edition. We can run Grafana on our own hardware or use Grafana Cloud. We can install Grafana using Grafana official APT repository, by downloading a .deb package, or by downloading a binary .tar.gz file.
Grafana Installation on Debian 11
Prerequisites
Before we start the Grafana installation on Debian 11, we must prepare the environment to support the installation process will be running smoothly. The prerequisites are as follow :
- A system user with sudo either as root privileges,
- Sufficient space (Grafanan requires about 170 MB dsik space)
- Good internet connection for downloading required package
- The updated Debian 11 system, this step could be acvhieved by submitting command line sudo apt update
The installation of grafana on Debian 11 will consist of several stages, namely:
- Add Grafana OSS stable release Repository
- Install Grafana
- Access Grafana Dashboard on Ubuntu
1. Add Grafana OSS stable release Repository
On this tutorial, we will Install from the Grafana Official APT repository. The first step, we will install prerequisites package. The installation process will be shown below :
$ sudo apt-get install -y apt-transport-https
$ wget -q -O - https://packages.grafana.com/gpg.key | sudo apt-key add -
Output :
ramansah@otodiginet:~$ wget -q -O - https://packages.grafana.com/gpg.key | sudo apt-key add -
Warning: apt-key is deprecated. Manage keyring files in trusted.gpg.d instead (see apt-key(8)).
OK
ramansah@otodiginet:~$ echo "deb https://packages.grafana.com/oss/deb stable main" | sudo tee -a /etc/apt/sources.list.d/grafana.list
Also we will install the following needed packages. By using apt or apt-get, as shown below:
$ sudo apt-get install -y apt-transport-https
$ sudo apt-get install -y software-properties-common wget
Output :
ramansah@otodiginet:~$ sudo apt-get install -y apt-transport-https
[sudo] password for ramansah:
Reading package lists... Done
Building dependency tree... Done
Reading state information... Done
The following NEW packages will be installed:
  apt-transport-https
0 upgraded, 1 newly installed, 0 to remove and 3 not upgraded.
Need to get 160 kB of archives.
After this operation, 166 kB of additional disk space will be used.
Get:1 http://deb.debian.org/debian bullseye/main amd64 apt-transport-https all 2.2.4 [160 kB]
Fetched 160 kB in 2s (87.2 kB/s)
Selecting previously unselected package apt-transport-https.
(Reading database ... 137093 files and directories currently installed.)
Preparing to unpack .../apt-transport-https_2.2.4_all.deb ...
Unpacking apt-transport-https (2.2.4) ...
Setting up apt-transport-https (2.2.4) ...
ramansah@otodiginet:~$ sudo apt-get install -y software-properties-common wget
Reading package lists... Done
Building dependency tree... Done
Reading state information... Done
software-properties-common is already the newest version (0.96.20.2-2.1).
software-properties-common set to manually installed.
wget is already the newest version (1.21-1+b1).
0 upgraded, 0 newly installed, 0 to remove and 3 not upgraded.
2. Install Grafana OSS on Debian 11
2.1. Installing Grafana
After the repository has been added, we will run the following commands to update repositories and install the latest version of Grafana.
$ sudo apt-get update
$ sudo apt-get install grafana
Output :
ramansah@otodiginet:~$ sudo apt-get update
Hit:1 http://security.debian.org/debian-security bullseye-security InRelease
Hit:2 http://ftp.debian.org/debian stretch-backports InRelease
Hit:3 http://deb.debian.org/debian bullseye InRelease
Hit:4 http://deb.debian.org/debian bullseye-updates InRelease
Hit:5 http://deb.debian.org/debian bullseye-backports InRelease
Get:6 https://packages.grafana.com/oss/deb stable InRelease [12.1 kB]
Hit:7 https://downloads.apache.org/cassandra/debian 40x InRelease
Get:8 https://packages.grafana.com/oss/deb beta InRelease [12.1 kB]
Get:9 https://packages.grafana.com/oss/deb stable/main amd64 Packages [24.8 kB]
Get:10 https://packages.grafana.com/oss/deb beta/main amd64 Packages [9,264 B]
Fetched 58.2 kB in 4s (16.3 kB/s)
Reading package lists... Done
ramansah@otodiginet:~$ sudo apt-get install grafana
Reading package lists... Done
Building dependency tree... Done
Reading state information... Done
The following NEW packages will be installed:
  grafana
0 upgraded, 1 newly installed, 0 to remove and 3 not upgraded.
Need to get 66.5 MB of archives.
After this operation, 224 MB of additional disk space will be used.
Get:1 https://packages.grafana.com/oss/deb beta/main amd64 grafana amd64 8.2.0~beta2 [66.5 MB]
Fetched 66.5 MB in 1min 12s (918 kB/s)
Selecting previously unselected package grafana.
(Reading database ... 137097 files and directories currently installed.)
Preparing to unpack .../grafana_8.2.0~beta2_amd64.deb ...
Unpacking grafana (8.2.0~beta2) ...
Setting up grafana (8.2.0~beta2) ...
Adding system user `grafana' (UID 117) ...
Adding new user `grafana' (UID 117) with group `grafana' ...
Not creating home directory `/usr/share/grafana'.
### NOT starting on installation, please execute the following statements to configure grafana to start automatically using systemd
 sudo /bin/systemctl daemon-reload
 sudo /bin/systemctl enable grafana-server
### You can start grafana-server by executing
 sudo /bin/systemctl start grafana-server
2.2. Starting the Grafana Service
By default Grafana service is nut running automatically after installing was completed. We need to start grafana-server service by following the step shown below :
$ sudo systemctl daemon-reload
$ sudo systemctl start grafana-server
$ sudo systemctl status grafana-server
Output :
ramansah@otodiginet:~$ sudo systemctl daemon-reload
ramansah@otodiginet:~$ sudo systemctl start grafana-server
ramansah@otodiginet:~$ sudo systemctl status grafana-server
? grafana-server.service - Grafana instance
     Loaded: loaded (/lib/systemd/system/grafana-server.service; disabled; vendor preset: enabled)
     Active: active (running) since Mon 2021-10-04 05:05:07 EDT; 13s ago
       Docs: http://docs.grafana.org
   Main PID: 4887 (grafana-server)
      Tasks: 10 (limit: 4623)
     Memory: 89.3M
        CPU: 1.123s
     CGroup: /system.slice/grafana-server.service
             ??4887 /usr/sbin/grafana-server --config=/etc/grafana/grafana.ini --pidfile=/run/grafana/g>

Oct 04 05:05:09 otodiginet grafana-server[4887]: t=2021-10-04T05:05:09-0400 lvl=info msg="Executing mig>
Oct 04 05:05:09 otodiginet grafana-server[4887]: t=2021-10-04T05:05:09-0400 lvl=info msg="migrations co>
Oct 04 05:05:09 otodiginet grafana-server[4887]: t=2021-10-04T05:05:09-0400 lvl=info msg="Created defau>
Oct 04 05:05:09 otodiginet grafana-server[4887]: t=2021-10-04T05:05:09-0400 lvl=info msg="Created defau>
Oct 04 05:05:09 otodiginet grafana-server[4887]: t=2021-10-04T05:05:09-0400 lvl=info msg="Starting plug>
Oct 04 05:05:09 otodiginet grafana-server[4887]: t=2021-10-04T05:05:09-0400 lvl=info msg="Registering p>
Oct 04 05:05:09 otodiginet grafana-server[4887]: t=2021-10-04T05:05:09-0400 lvl=info msg="External plug>
Oct 04 05:05:09 otodiginet grafana-server[4887]: t=2021-10-04T05:05:09-0400 lvl=info msg="Live Push Gat>
Oct 04 05:05:09 otodiginet grafana-server[4887]: t=2021-10-04T05:05:09-0400 lvl=info msg="Writing PID f>
Oct 04 05:05:09 otodiginet grafana-server[4887]: t=2021-10-04T05:05:09-0400 lvl=info msg="HTTP Server L>
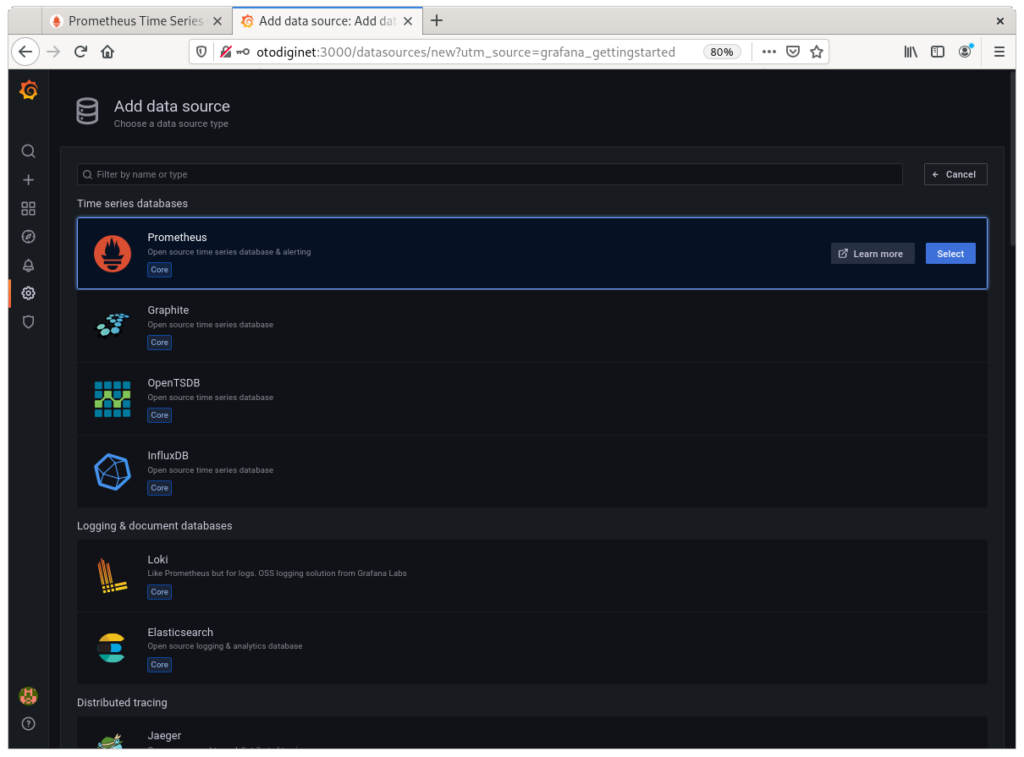
3. Access Grafana Web Interface
After Grafana the Grafana server has started, we can access it through the URL. By default Grafana service is binding on prot 3000, so we will hit Grafana URL on : http://ipaddress_or_hostname:3000.

Grafana’s default user and password are “admin” and “admin”. After log in to Grafana, we need to change it.

Conclusion
In this short tutorial we have installed Grafana OSS on Debian 11 operating system successfully. I hope this tutorial will be helpful.