How to Install Grafana on CentOS Stream 9
Grafana is a powerful and open-source data visualization and monitoring tool that integrates with various data sources, such as Prometheus, InfluxDB, and Elasticsearch. It allows you to create dynamic dashboards and alerts, making it an essential tool for monitoring your infrastructure and applications. In this article, we will guide you through the steps to install Grafana on CentOS Stream 9.
Prerequisites
Before you begin, ensure you have the following:
- A server running CentOS Stream.
- Root or sudo privileges to install packages and configure the system.
Step 1: Update Your System
First, update your system to ensure you have the latest packages and security patches:
$ sudo dnf update -y
Step 2: Add the Grafana Repository
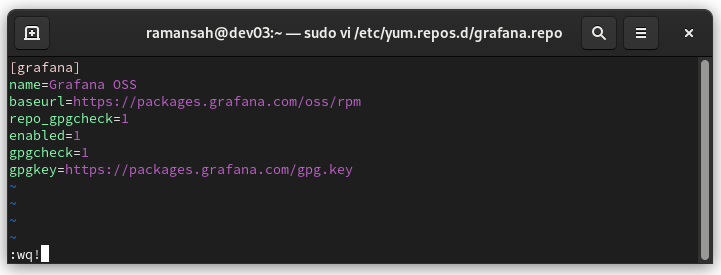
Grafana is not included in the default CentOS repositories, so you need to add the Grafana repository. Create a new repository file for Grafana:
$ sudo vi /etc/yum.repos.d/grafana.repo
Add the following content to the file:
[grafana]
name=Grafana OSS
baseurl=https://packages.grafana.com/oss/rpm
repo_gpgcheck=1
enabled=1
gpgcheck=1
gpgkey=https://packages.grafana.com/gpg.key
Step 3: Install Grafana
With the repository added, you can now install Grafana using the following command:
$ sudo dnf install grafana -y
Output :
ramansah@dev03 ~]$ sudo dnf install grafana -y
Grafana OSS                                                               1.4 kB/s | 712  B     00:00
Grafana OSS                                                                14 kB/s | 2.4 kB     00:00
Importing GPG key 0x10458545:
 Userid     : "Grafana Labs <engineering@grafana.com>"
 Fingerprint: B53A E77B ADB6 30A6 8304 6005 963F A277 1045 8545
 From       : https://packages.grafana.com/gpg.key
Grafana OSS                                                                3.4 MB/s | 101 MB     00:30
Last metadata expiration check: 0:00:47 ago on Sat 29 Jun 2024 11:09:39 PM WIB.
Dependencies resolved.
===========================================================================================================
 Package                  Architecture            Version                   Repository                Size
===========================================================================================================
Installing:
 grafana                  x86_64                  11.1.0-1                  grafana                  111 M

Transaction Summary
===========================================================================================================
Install  1 Package

Total download size: 111 M
Installed size: 417 M
Downloading Packages:
grafana-11.1.0-1.x86_64.rpm                                                4.2 MB/s | 111 MB     00:26
-----------------------------------------------------------------------------------------------------------
Total                                                                      4.2 MB/s | 111 MB     00:26
Grafana OSS                                                                 15 kB/s | 2.4 kB     00:00
Importing GPG key 0x10458545:
 Userid     : "Grafana Labs <engineering@grafana.com>"
 Fingerprint: B53A E77B ADB6 30A6 8304 6005 963F A277 1045 8545
 From       : https://packages.grafana.com/gpg.key
Key imported successfully
Running transaction check
Transaction check succeeded.
Running transaction test
Transaction test succeeded.
Running transaction
  Preparing        :                                                                                   1/1
  Installing       : grafana-11.1.0-1.x86_64                                                           1/1
  Running scriptlet: grafana-11.1.0-1.x86_64                                                           1/1
### NOT starting on installation, please execute the following statements to configure grafana to start automatically using systemd
 sudo /bin/systemctl daemon-reload
 sudo /bin/systemctl enable grafana-server.service
### You can start grafana-server by executing
 sudo /bin/systemctl start grafana-server.service

POSTTRANS: Running script

  Verifying        : grafana-11.1.0-1.x86_64                                                           1/1

Installed:
  grafana-11.1.0-1.x86_64

Complete!
[ramansah@dev03 ~]$
Step 4: Start and Enable Grafana
After the installation is complete, start the Grafana service and enable it to start on boot:
$ sudo systemctl start grafana-server
$ sudo systemctl enable grafana-server
Output :
[ramansah@dev03 ~]$ sudo systemctl start grafana-server
[ramansah@dev03 ~]$ sudo systemctl enable grafana-server
Created symlink /etc/systemd/system/multi-user.target.wants/grafana-server.service → /usr/lib/systemd/system/grafana-server.service.
Step 5: Verify Grafana Installation
To verify that Grafana is running, check the status of the Grafana service:
$ sudo systemctl status grafana-server
Output :
ramansah@dev03 ~]$ sudo systemctl status grafana-server
● grafana-server.service - Grafana instance
     Loaded: loaded (/usr/lib/systemd/system/grafana-server.service; enabled; preset: disabled)
     Active: active (running) since Sat 2024-06-29 23:14:15 WIB; 29s ago
       Docs: http://docs.grafana.org
   Main PID: 75194 (grafana)
      Tasks: 14 (limit: 22828)
     Memory: 55.8M
        CPU: 2.281s
     CGroup: /system.slice/grafana-server.service
             └─75194 /usr/share/grafana/bin/grafana server --config=/etc/grafana/grafana.ini --pidfile=/va>

Jun 29 23:14:15 dev03.infodiginet grafana[75194]: logger=ticker t=2024-06-29T23:14:15.778083452+07:00 leve>
Jun 29 23:14:15 dev03.infodiginet grafana[75194]: logger=sqlstore.transactions t=2024-06-29T23:14:15.77753>
Jun 29 23:14:15 dev03.infodiginet grafana[75194]: logger=sqlstore.transactions t=2024-06-29T23:14:15.81789>
Jun 29 23:14:15 dev03.infodiginet grafana[75194]: logger=provisioning.dashboard t=2024-06-29T23:14:15.8534>
Jun 29 23:14:15 dev03.infodiginet grafana[75194]: logger=provisioning.dashboard t=2024-06-29T23:14:15.8535>
Jun 29 23:14:16 dev03.infodiginet grafana[75194]: logger=plugin.angulardetectorsprovider.dynamic t=2024-06>
Jun 29 23:14:16 dev03.infodiginet grafana[75194]: logger=plugins.update.checker t=2024-06-29T23:14:16.1616>
Jun 29 23:14:16 dev03.infodiginet grafana[75194]: logger=grafana.update.checker t=2024-06-29T23:14:16.1780>
Jun 29 23:14:16 dev03.infodiginet grafana[75194]: logger=grafana-apiserver t=2024-06-29T23:14:16.207402966>
Jun 29 23:14:16 dev03.infodiginet grafana[75194]: logger=grafana-apiserver t=2024-06-29T23:14:16.208205444>
You should see the Grafana service is running.
Step 6: Configure Firewall
If you have a firewall enabled, you need to allow traffic on port 3000, which Grafana uses by default. Use the following commands to configure the firewall:
[ramansah@dev03 ~]$ sudo firewall-cmd --permanent --zone=public --add-port=3000/tcp
success
[ramansah@dev03 ~]$ sudo firewall-cmd --reload
success
Step 7: Access Grafana Web Interface
Grafana’s web interface is accessible via port 3000. Open a web browser and enter your server’s IP address followed by :3000:
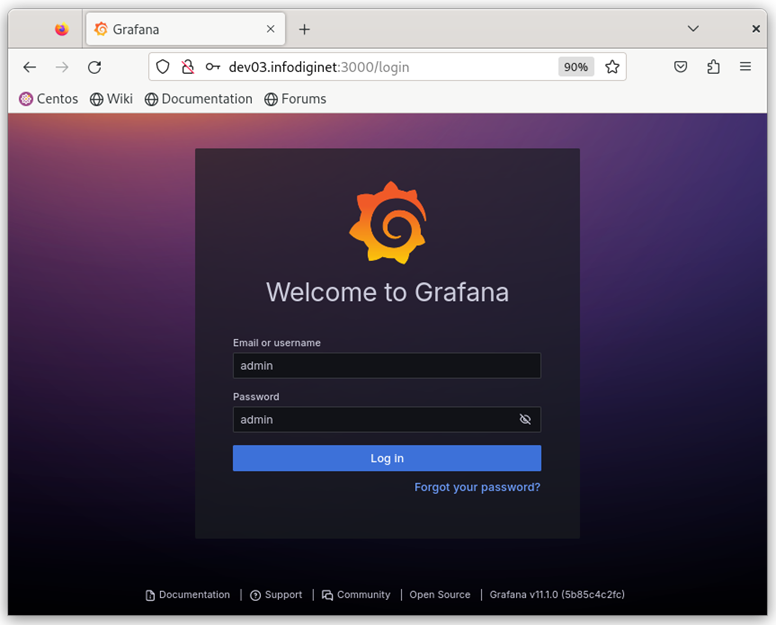
Step 8: Log In to Grafana
The default login credentials for Grafana are:
- Username: admin
- Password: admin
After logging in for the first time, you will be prompted to change the default password.
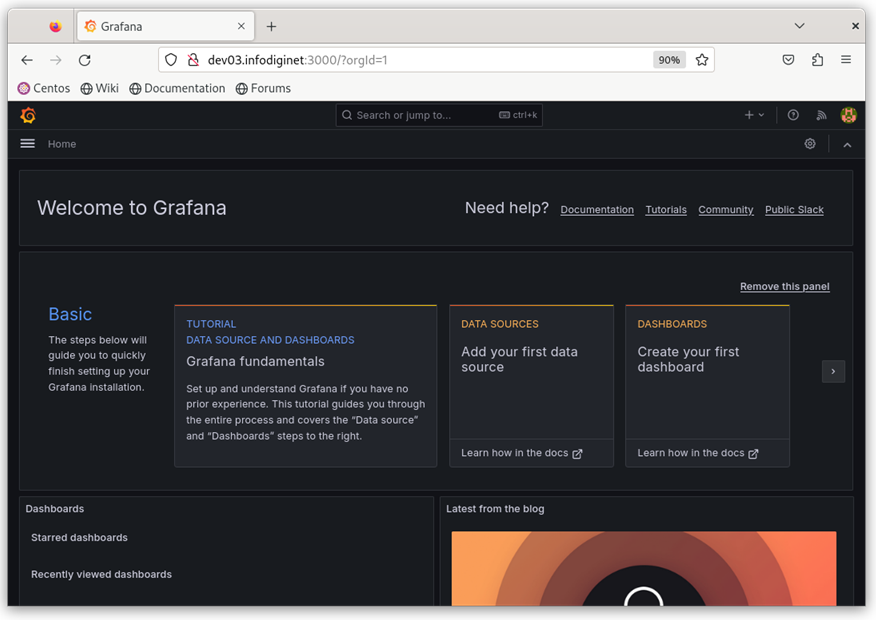
Step 9: Add Data Sources and Create Dashboards
Once logged in, you can start adding data sources and creating dashboards to visualize your data. Grafana supports a wide range of data sources, including Prometheus, InfluxDB, Elasticsearch, and many more.
Conclusion
You have successfully installed Grafana on CentOS Stream. Grafana’s powerful visualization capabilities will enable you to monitor and analyze your data efficiently. For more advanced configurations and features, refer to the official Grafana documentation.
By following these steps, you can set up a robust monitoring and visualization platform to keep an eye on your infrastructure and applications.