How To Install Grafana On Ubuntu 22.04 LTS Operating System
In this short article we will discuss how to install Grafana on Ubuntu 22.04 LTS operating system. Grarana is empowering data visualization and monitoring.
Introduction
In today’s data-driven world, it’s crucial to have effective tools for visualizing and monitoring data to gain valuable insights. Grafana is an open-source data visualization and monitoring platform that provides a feature-rich and user-friendly interface for creating dashboards and monitoring various data sources. In this article, we will explore what Grafana is, its key features, how it works, and how it can empower organizations to make informed decisions through data visualization and monitoring.
What is Grafana?
Grafana is a multi-platform open-source analytics and monitoring tool that allows users to create visually stunning and interactive dashboards. Originally designed for monitoring time-series data, Grafana has evolved into a versatile platform that supports various data sources, including databases, cloud services, and other monitoring systems.
Key Features of Grafana:
- Data Source Integration: Grafana supports a wide range of data sources, including popular databases like MySQL, PostgreSQL, and InfluxDB, cloud platforms like AWS and Google Cloud, as well as monitoring systems like Prometheus and Elasticsearch.
- Customizable Dashboards: Users can create custom dashboards with a variety of panels, such as graphs, tables, and heatmaps, to visualize data and present it in a way that best suits their needs.
- Templating and Variables: Grafana allows the use of variables and templates in queries and dashboard configurations, making it easy to create dynamic and interactive dashboards.
- Alerting and Notifications: Grafana provides robust alerting capabilities that can trigger notifications via various channels, including email, Slack, and webhooks, enabling users to take timely actions based on data insights.
- Plugin Support: Grafana’s plugin architecture allows users to extend its functionality by adding community-developed plugins, providing endless possibilities for integrating with different data sources and services.
- Team Collaboration: Grafana supports team collaboration by allowing users to share dashboards and collaborate on monitoring and visualization tasks.
- Rich Visualization Options: Grafana offers a wide range of visualization options, including line charts, bar charts, pie charts, and more, along with interactive features like zooming and data filtering.
Installing Grafana On Ubuntu 22.04 LTS Operating System
Installing Grafana on Ubuntu is a straightforward process. Grafana provides a Debian package that can be easily installed using the package manager. Here are the steps to install Grafana on Ubuntu 22.04 :
Step 1: Update System Packages
Step 2: Install Dependencies Packages
Step 3: Add Grafana Repository
Step 4: Install Grafana
Step 5: Start Grafana Service
Step 6: Access Grafana Web Interface
Step 1: Update System Packages
Before installing any new software, it’s a good practice to update the system packages. Open a terminal and run the following command :
$ sudo apt update
Step 2: Install Dependencies
Grafana requires some dependencies to be installed on your system. Use the following command to install them:
$ sudo apt install -y software-properties-common
Step 3: Add Grafana Repository
Grafana is not available in the default Ubuntu repositories. We need to add the Grafana repository to our system using the following commands:
Import Grafana GPG Key
$ wget -q -O - https://packages.grafana.com/gpg.key | gpg --dearmor | sudo tee /usr/share/keyrings/grafana.gpg > /dev/null
Add Grafana APT Repository
$ echo "deb [signed-by=/usr/share/keyrings/grafana.gpg] https://packages.grafana.com/oss/deb stable main" | sudo tee -a /etc/apt/sources.list.d/grafana.list
Output :
ramansah@infodiginet:~$ wget -q -O - https://packages.grafana.com/gpg.key | gpg --dearmor | sudo tee /usr/share/keyrings/grafana.gpg > /dev/null
ramansah@infodiginet:~$ echo "deb [signed-by=/usr/share/keyrings/grafana.gpg] https://packages.grafana.com/oss/deb stable main" | sudo tee -a /etc/apt/sources.list.d/grafana.list
deb [signed-by=/usr/share/keyrings/grafana.gpg] https://packages.grafana.com/oss/deb stable main
Step 4: Install Grafana
After adding the repository and importing the GPG key, update the package index again and install Grafana:
$ sudo apt update
$ sudo apt install grafana
Output :
ramansah@infodiginet:~$ sudo apt update
Get:1 https://packages.grafana.com/oss/deb stable InRelease [5.984 B]
Get:2 https://packages.grafana.com/oss/deb stable/main amd64 Packages [135 kB]
Hit:3 http://security.ubuntu.com/ubuntu jammy-security InRelease
Hit:4 http://id.archive.ubuntu.com/ubuntu jammy InRelease
Hit:5 https://ppa.launchpadcontent.net/eugenesan/ppa/ubuntu jammy InRelease
Hit:6 http://id.archive.ubuntu.com/ubuntu jammy-updates InRelease
Hit:7 http://id.archive.ubuntu.com/ubuntu jammy-backports InRelease
Fetched 141 kB in 1s (97,5 kB/s)
Reading package lists... Done
Building dependency tree... Done
Reading state information... Done
136 packages can be upgraded. Run 'apt list --upgradable' to see them.
N: Skipping acquire of configured file 'main/binary-i386/Packages' as repository 'https://packages.grafana.com/oss/deb stable InRelease' doesn't support architecture 'i386'
ramansah@infodiginet:~$ sudo apt install grafana
Reading package lists... Done
Building dependency tree... Done
Reading state information... Done
The following NEW packages will be installed:
  grafana
0 upgraded, 1 newly installed, 0 to remove and 136 not upgraded.
Need to get 83,4 MB of archives.
After this operation, 306 MB of additional disk space will be used.
Get:1 https://packages.grafana.com/oss/deb stable/main amd64 grafana amd64 10.0.3 [83,4 MB]
Fetched 83,4 MB in 5min 37s (247 kB/s)
Selecting previously unselected package grafana.
(Reading database ... 199591 files and directories currently installed.)
Preparing to unpack .../grafana_10.0.3_amd64.deb ...
Unpacking grafana (10.0.3) ...
Setting up grafana (10.0.3) ...
Adding system user `grafana' (UID 129) ...
Adding new user `grafana' (UID 129) with group `grafana' ...
Not creating home directory `/usr/share/grafana'.
### NOT starting on installation, please execute the following statements to configure grafana to start automatically using systemd
 sudo /bin/systemctl daemon-reload
 sudo /bin/systemctl enable grafana-server
### You can start grafana-server by executing
 sudo /bin/systemctl start grafana-server
Step 6: Start Grafana Service
Once Grafana is installed, start the Grafana service and enable it to run on system boot :
sudo systemctl start grafana-server
sudo systemctl enable grafana-server
Output :
ramansah@infodiginet:~$ sudo systemctl start grafana-server
ramansah@infodiginet:~$ sudo systemctl enable grafana-server
Synchronizing state of grafana-server.service with SysV service script with /lib/systemd/systemd-sysv-install.
Executing: /lib/systemd/systemd-sysv-install enable grafana-server
Created symlink /etc/systemd/system/multi-user.target.wants/grafana-server.service → /lib/systemd/system/grafana-server.service.
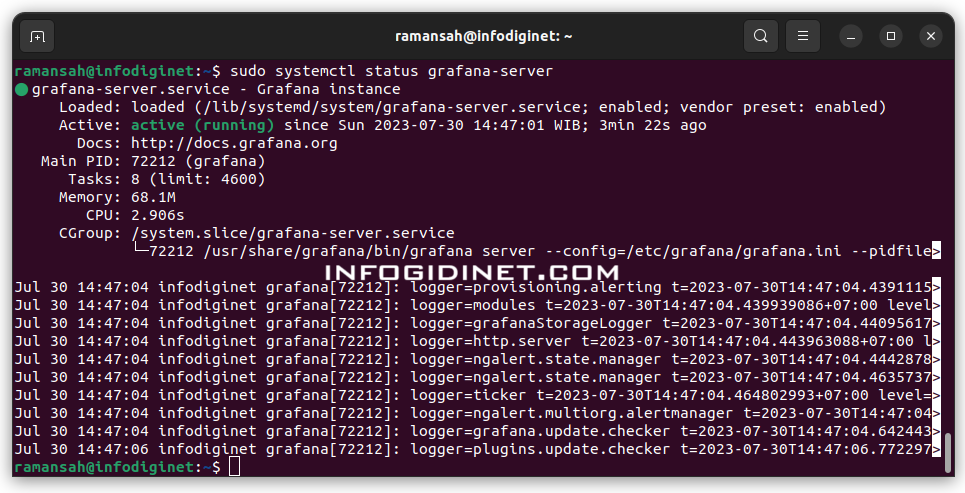
Then we will check if Grafana service is already running well on the system, by submitting command line :
$ sudo systemctl status grafana-server
Output :
ramansah@infodiginet:~$ sudo systemctl status grafana-server
● grafana-server.service - Grafana instance
     Loaded: loaded (/lib/systemd/system/grafana-server.service; enabled; vendor preset: enabled)
     Active: active (running) since Sun 2023-07-30 14:47:01 WIB; 3min 22s ago
       Docs: http://docs.grafana.org
   Main PID: 72212 (grafana)
      Tasks: 8 (limit: 4600)
     Memory: 68.1M
        CPU: 2.906s
     CGroup: /system.slice/grafana-server.service
             └─72212 /usr/share/grafana/bin/grafana server --config=/etc/grafana/grafana.ini --pidfile>

Jul 30 14:47:04 infodiginet grafana[72212]: logger=provisioning.alerting t=2023-07-30T14:47:04.4391115>
Jul 30 14:47:04 infodiginet grafana[72212]: logger=modules t=2023-07-30T14:47:04.439939086+07:00 level>
Jul 30 14:47:04 infodiginet grafana[72212]: logger=grafanaStorageLogger t=2023-07-30T14:47:04.44095617>
Jul 30 14:47:04 infodiginet grafana[72212]: logger=http.server t=2023-07-30T14:47:04.443963088+07:00 l>
Jul 30 14:47:04 infodiginet grafana[72212]: logger=ngalert.state.manager t=2023-07-30T14:47:04.4442878>
Jul 30 14:47:04 infodiginet grafana[72212]: logger=ngalert.state.manager t=2023-07-30T14:47:04.4635737>
Jul 30 14:47:04 infodiginet grafana[72212]: logger=ticker t=2023-07-30T14:47:04.464802993+07:00 level=>
Jul 30 14:47:04 infodiginet grafana[72212]: logger=ngalert.multiorg.alertmanager t=2023-07-30T14:47:04>
Jul 30 14:47:04 infodiginet grafana[72212]: logger=grafana.update.checker t=2023-07-30T14:47:04.642443>
Jul 30 14:47:06 infodiginet grafana[72212]: logger=plugins.update.checker t=2023-07-30T14:47:06.772297
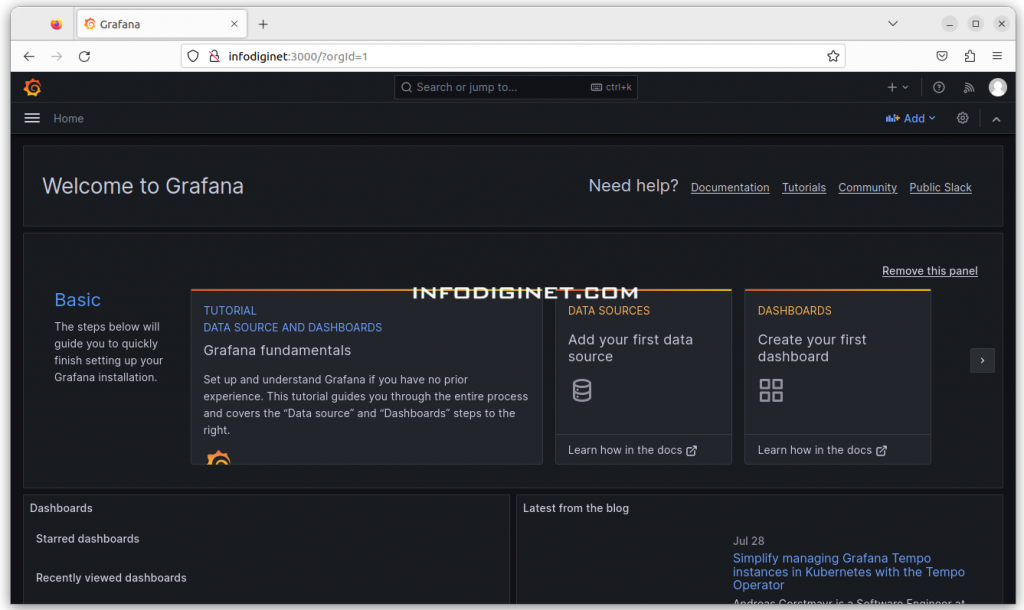
Step 7: Access Grafana Web Interface
Grafana is now running on our system, to access it, just open web browser and navigate to http://localhost:3000 or http://server-ip:3000 to access the Grafana web interface.

Log in to Grafana
The default login credentials for Grafana are as follows:
Username: admin
Password: admin
So far, we have successfully installed Grafana on Ubuntu 22.04 system.
Conclusion
Grafana is now ready to be used for creating beautiful and interactive dashboards to visualize our data. We can start adding data sources, creating dashboards, and exploring the powerful features that Grafana offers for data visualization and monitoring. Enjoy using Grafana to gain valuable insights from our data in a user-friendly and customizable interface!